The Fittest ZIP Code in Every State — 2026 Data

More and more data is coming to light that where you live can have a big impact on your health. Areas that make walking and movement (not being forced to drive everywhere), activity levels of its inhabitants, access to fitness studios and gyms…all this adds up to helping people stay fitter. Parks and green spaces are also huge signals that an area is better for your fitness than a cement landscape with nowhere to walk to.
We wanted to find the fittest zip codes in each state in the US. We analyzed 17,747 US Zip codes and looked as a number of data points to create our proprietary score.
Here’s how we created Each Zip Code’s score:
- Access to gyms and fitness studios, accounting for 35% of the Fitness Score
- Amount of physical activity ZIP code residents engage in, which accounts for 25% of the Fitness Score
- Walkability, which accounts for 25% of the Fitness Score
- Access to parks and green spaces, which accounts for 15% of the Fitness Score
Scores are on a scale of 0-100, where 100 is the highest score possible, based on the percentiles in which each ZIP code falls for each category. Only five ZIP codes earned a perfect score. The winning ZIP code with the lowest Fitness Score in the U.S. received a score of 71. We also removed ZIP codes with a population of less than 2,500.
Here’s how to read it. Under each score there’s a block of health measures for the folks who live in that ZIP code. The green and red percentages show where they land against the national median.
So let’s dive in! Do you live in the fittest zip code in your state? Find out below!
The Fittest ZIP Code in Every State
Alabama
Green means better than the national median across 15,961 ZIP codes. Source: CDC PLACES, 2025 release.
Alabama’s winning ZIP is Birmingham’s Southside, which has a score of 100 for access to parks and 92 for walkability. The ZIP’s activity level is reflected by the percentage of residents who say they get no exercise during leisure time, 19.2% as opposed to 30.4% in the rest of the state, as well as high blood pressure rates, at 21.5% as opposed to a median of 44.3% in the rest of Alabama. However, we did not happen to have a gym in our dataset within three kilometers of the ZIP.
- High blood pressure 21.5% against an Alabama median of 44.3%, the second-widest state gap on any card here
- Obesity 28.2% here against 39.4% statewide, and 35.3% nationally
- The complication: life expectancy is 72.7 years, lower than 97% of American ZIP codes, a reminder that a fit built environment and a long life are not the same thing
Alaska
Green means better than the national median across 15,961 ZIP codes. Source: CDC PLACES, 2025 release.
Joint Base Elmendorf-Richardson in Alaska is probably young, healthy, fit, and screened for these characteristics (military). It has the second-lowest rate of people with high blood pressure (14.5%), while just 14.8% get no leisure-time exercise. Activity in this ZIP scores 97 out of 100.
- High blood pressure 14.5%, against an Alaska median of 32.3% and a national median of 35.4%
- Activity ranks in the 97th percentile nationally, the highest of any winner outside a major metro
- Read this one carefully: a base population is not a civilian one, and no measured gym or studio sits within three kilometers of the ZIP centroid
Arizona
Green means better than the national median across 15,961 ZIP codes. Source: CDC PLACES, 2025 release.
South Tempe, Arizona is a suburb with unusually good access to gyms, including, perhaps, the kind of fitness centers available at resorts. It also has a comparatively low percentage, 13.5% as opposed to 22.5% in the rest of Arizona and 25.5% in the nation as a whole, of people who don’t engage in leisure-time physical activity, representing one of the largest such differentials between ZIP and state in this article.
- Obesity runs 25.5% here against an Arizona median of 31.3% and a national median of 35.3%
- 135 mapped parks and green spaces sit inside the ZIP, among the highest counts of the 51 winners
- The defining edge: people in 85284 live to 83.4 on average, better than 92% of American ZIP codes
4 measured locations within three kilometers of the ZIP centroid. The busiest sees about 3,648 people a day.
Arkansas
Green means better than the national median across 15,961 ZIP codes. Source: CDC PLACES, 2025 release.
Arkansas’ winner, the Heights neighborhood in Little Rock, has a score of 95 for access to gyms and a score of 86 for walkability. There are five gyms we could locate within three kilometers of the ZIP, the busiest of which is a 10 Fitness that gets 392,544 visits per year. The percentage of residents who don’t exercise during their leisure time is 19.0% compared to a state average of 34.0%, marking a difference of 15 percentage points, one of the largest in this article.
- No leisure-time exercise 19.0% here against an Arkansas median of 34.0%
- Life expectancy 82.2 years, higher than 86% of American ZIP codes
- The defining edge: 10 Fitness on the west side draws 392,544 visits a year, roughly 1,075 people a day
5 measured locations within three kilometers of the ZIP centroid. The busiest sees about 1,075 people a day.
California
Green means better than the national median across 15,961 ZIP codes. Source: CDC PLACES, 2025 release.
San Francisco’s South Beach and Rincon Hill has one of the nation’s five 100-scoring ZIPs with access to gyms and walkability both getting perfect scores. Twenty gyms can be found within three kilometers of the ZIP. Its rates of obesity (14.9%) and of people with high blood pressure (17.5%) are among the article’s five lowest.
- Obesity 14.9%, the second-lowest of all 51 winners and 20 points below the national median
- Twenty mapped fitness venues within three kilometers, plus six measured chain locations
- The defining edge: perfect 100s for gym access, walkability and the overall score together, which only five ZIP codes in the country manage
6 measured locations within three kilometers of the ZIP centroid. The busiest sees about 1,392 people a day.
Colorado
Green means better than the national median across 15,961 ZIP codes. Source: CDC PLACES, 2025 release.
Cheesman Park is a neighborhood in Denver. Only two winning ZIPs that don’t score 100 manage to score a perfect 100 for activity, with Cheesman Park being one of them. It also has the article’s fourth-lowest percentage of people who don’t get regular leisure-time exercise (11.6%). The rate of obesity is 19.1%, well below the national median (35.3%). Seven fitness centers can be found within three kilometers of the ZIP, including an Anytime Fitness, a boxing studio, and a barre studio, all three within one mile.
- No leisure-time exercise 11.6%, the fourth-lowest of the 51 winners, against a Colorado median of 17.1%
- High blood pressure 17.6%, roughly half the national median of 35.4%
- The complication: life expectancy is 76.6 years here, below the national median, which sits oddly against health readings this strong
7 measured locations within three kilometers of the ZIP centroid. The busiest sees about 180 people a day.
Connecticut
Green means better than the national median across 15,961 ZIP codes. Source: CDC PLACES, 2025 release.
Downtown New Haven, Connecticut scores 100 for access to parks and 99 for access to gyms, yet its score for activity is a comparatively low 78. Its percentage of people with high blood pressure is low at 19.7% as opposed to a median of 32.5% in Connecticut, while its percentage who are obese is not (27.7%). The percentage of people who don’t get enough sleep is higher than the rest of the state.
- High blood pressure 19.7% against a Connecticut median of 32.5%
- 49 mapped parks and green spaces, and a perfect 100 for park access
- The outlier: 37.2% sleep under seven hours, three points worse than the Connecticut median and the only health measure on this card that loses to the state
Delaware
Green means better than the national median across 15,961 ZIP codes. Source: CDC PLACES, 2025 release.
Delaware’s top-scoring ZIP is Wilmington’s Trolley Square neighborhood which gets 98s in both walkability and access to parks. Surprisingly, we didn’t find a fitness center we could measure within three kilometers of the ZIP. The percentage of residents who don’t engage in regular physical activity is 20.6% as opposed to 28.2% in the rest of Delaware. The percentage of residents who don’t get enough sleep, defined in the survey as less than seven hours a night, is also lower than the rest of the state: 30.3% vs. 35.8%.
- Sleeping under seven hours 30.3%, nearly six points better than the national median
- Walkability and park access both score 98 out of 100
- Read the gym number carefully: the gym-access score of 80 rests on zero mapped fitness venues within three kilometers, a coverage gap rather than a finding
Florida
Green means better than the national median across 15,961 ZIP codes. Source: CDC PLACES, 2025 release.
Old Northeast is a neighborhood in Saint Petersburg in Florida. It has relatively good scores in each of the four areas we’re measuring with scores ranging from 91-98. Six chain gyms we could locate are within three kilometers of the ZIP, the busiest being a Crunch Fitness getting 874,728 visits a year. Only 17.2% of Old Northeast residents say they don’t engage in leisure-time exercise, well below the percentage in the rest of Florida (26.0%).
- Obesity 29.1% here against a Florida median of 32.0% and a national median of 35.3%
- Six measured fitness locations within three kilometers, from a big-box gym to an F45 and a Yoga Six
- The defining edge: the Crunch on 4th Street draws 874,728 visits a year, about 2,400 people a day
6 measured locations within three kilometers of the ZIP centroid. The busiest sees about 2,397 people a day.
Georgia
Green means better than the national median across 15,961 ZIP codes. Source: CDC PLACES, 2025 release.
Georgia’s top-scoring ZIP is Midtown Atlanta, a ZIP that has more residents (31,856) than all but two of our winners. It has relatively good scores in all four areas, especially for activity and walkability, both of which score 99. Access to parks scores a still-impressive 85. Its percentage of residents who don’t engage in leisure-time exercise, at 13.2% as opposed to 28.7% in the rest of the state, and obesity at 22.9% as opposed to 36.9% are well-below the rest of the state.
- Obesity 22.9% here against a Georgia median of 36.9%, a fourteen-point gap
- High blood pressure 22.8% against a state median of 39.4%
- The defining edge: 31,856 people live here, third-most of any winner, and the activity numbers hold up anyway
3 measured locations within three kilometers of the ZIP centroid. The busiest sees about 570 people a day.
Hawaii
Green means better than the national median across 15,961 ZIP codes. Source: CDC PLACES, 2025 release.
Downtown Honolulu has a comparatively high walkability score (97) but a fifth-from-the-bottom score (69) in terms of activity. Obesity is not a big problem, with 25.0% obese, ten percentage points below the nation’s median rate, but many residents don’t get enough sleep. 47.5% get inadequate rest, which is the largest such percentage in this article and more than eleven percentage points more than the nation’s median.
- Obesity 25.0%, more than ten points below the national median
- Sleeping under seven hours 47.5%, the highest figure on any card in this list
- The outlier: activity scores 69 out of 100, fifth-lowest of the 51 winners, yet the obesity number is among the ten best
3 measured locations within three kilometers of the ZIP centroid. The busiest sees about 284 people a day.
Idaho
Green means better than the national median across 15,961 ZIP codes. Source: CDC PLACES, 2025 release.
Boise’s East End ZIP scores 97 in terms of activity. It also does well compared to the rest of Idaho in terms of the percentage of residents who don’t engage in leisure-time exercise, at 15.2% as opposed to 23.1%, and of those who don’t get enough sleep (27.9% vs. 33.3%). No fitness centers that we could locate exist within three kilometers of the ZIP, representing an artifact of coverage in our gyms dataset that almost certainly doesn’t represent reality.
- Sleeping under seven hours 27.9%, more than eight points better than the national median
- Activity ranks 97 out of 100 nationally, tied for third among all state winners
- Read the gym number carefully: the gym-access score of 80 rests on zero mapped venues within three kilometers, which is a gap in our data, not an absence of gyms in Boise
Illinois
Green means better than the national median across 15,961 ZIP codes. Source: CDC PLACES, 2025 release.
Chicago’s Loop earns one of only five perfect 100 scores in the country, scoring 100 in all four factors. 25 fitness centers appear on our map within three kilometers. Just 10.6% of Loop residents say they get no leisure-time exercise, the best of our ZIP code winners. Only 8.0% report fair or poor health, compared with the national median of 19.7%.
- No leisure-time exercise 10.6%, the lowest reading of all 51 winners, against an Illinois median of 23.2%
- High blood pressure 15.6%, less than half the national median
- The defining edge: 25 mapped fitness venues inside three kilometers, tied with Washington D.C. and behind only Lower Manhattan
3 measured locations within three kilometers of the ZIP centroid. The busiest sees about 80 people a day.
Indiana
Green means better than the national median across 15,961 ZIP codes. Source: CDC PLACES, 2025 release.
Indiana’s winner, Downtown Indianapolis, scores between 96 and 99 in each category. Though it has a handful of fitness centers, mainly boutique options like Pure Barre, Club Pilates, and barre3 locations within a mile and a half, there’s no big-box gym among them. Still, the percentage of Indianapolis residents who get no leisure-time physical activity, 15.6%, is much lower than Indiana’s 26.0%. Life expectancy in Downtown Indianapolis is 74.1 years, worse than 92% of ZIP codes in America.
- High blood pressure 25.0% here against an Indiana median of 38.8%
- Three measured boutique studios within three kilometers and no measured big-box gym
- The complication: life expectancy 74.1 years, one of the lowest among the winners, against health readings that are otherwise strong
4 measured locations within three kilometers of the ZIP centroid. The busiest sees about 73 people a day.
Iowa
Green means better than the national median across 15,961 ZIP codes. Source: CDC PLACES, 2025 release.
Downtown Des Moines wins Iowa by virtue of its scores for access to gyms and parks in the high nineties. Inactivity is lower than the statewide rate at 18.0% compared with 25.5%, as is high blood pressure at 22.2% compared with 35.4%. Like Downtown Indianapolis, life expectancy in Downtown Des Moines is low, 69.8 years, which is lower than 99.6% of ZIP codes in America, a potential concern, though the ZIP has a small population that includes a lot of group quarters.
- High blood pressure 22.2%, thirteen points better than the national median
- Gym access 97 and park access 97, the two columns that win the state
- The complication: life expectancy 69.8 years, the lowest of any winner in this article and below 99% of American ZIP codes
Kansas
Green means better than the national median across 15,961 ZIP codes. Source: CDC PLACES, 2025 release.
Leawood, the winner in Kansas, is rare among our winners as a suburb. Though it doesn’t fare as well as some of the urban centers for walkability with a score of 80, its scores for access to gyms (98) and parks (95) are strong. There are seven gyms in the area within three kilometers, including Genesis Health Club, which gets 408,804 visits a year. Only 27.4% of Leawood residents say they’re not getting enough sleep, which is much better than the national median (36.1%), and residents enjoy a higher-than-usual life expectancy: 82.8 years on average.
- Sleeping under seven hours 27.4%, nearly nine points better than the national median
- Life expectancy 82.8 years, higher than 89% of American ZIP codes
- The exception on this card: high blood pressure runs 35.7%, essentially at the national median and the only measure here that does not beat it
7 measured locations within three kilometers of the ZIP centroid. The busiest sees about 1,120 people a day.
Kentucky
The 2025 CDC release publishes no ZIP-level chronic-disease data for Kentucky. The sleep figure is for ZIP 41073 against the national ZIP median; the remaining rows are Campbell County figures from County Health Rankings 2024, compared against the national county median.
Bellevue is Kentucky’s winner. The town across the river from Cincinnati scores a 99 for access to gyms. There are three gyms in the area within three kilometers, including a Planet Fitness that sees 536,550 visits a year. Kentucky did not include chronic disease data by ZIP in the latest (2025) release of CDC’s data, so there’s not much else we can say besides the percentage of Bellevue residents who say they’re not getting enough sleep is 37.2%. Kentucky also did not provide leisure-time physical activity data by ZIP, but the activity score of 67 comes from county data and should not be mistaken for a ZIP-specific estimate.
- The Planet Fitness across the river in Newport draws 536,550 visits a year, roughly 1,470 a day
- Park access scores 99 out of 100 despite a resident population under 5,600
- Read this card with the gap in mind: Kentucky has no ZIP-level CDC chronic disease data in the 2025 release, so this state’s activity score rests on county figures
3 measured locations within three kilometers of the ZIP centroid. The busiest sees about 1,470 people a day.
Louisiana
Green means better than the national median across 15,961 ZIP codes. Source: CDC PLACES, 2025 release.
Lower Garden District is the winner in Louisiana with a walkability score of 99. The percentage of residents who get no leisure-time exercise there (19.4%) is much better than Louisiana’s median ZIP code (32.0%), as are obesity at 28.8% compared with 41.0% and high blood pressure at 32.0% compared with 43.3%.
- Obesity 28.8% against a Louisiana median of 41.0%, a twelve-point gap
- High blood pressure 32.0% here against 43.3% across the state
- The defining edge: walkability 99 out of 100 in a state whose median ZIP scores nowhere near it
2 measured locations within three kilometers of the ZIP centroid. The busiest sees about 169 people a day.
Maine
Green means better than the national median across 15,961 ZIP codes. Source: CDC PLACES, 2025 release.
The peninsula that juts into the water gives Portland its top score in Maine, with a 99 for walkability, 141 mapped parks and other green spaces, and four fitness centers within three kilometers. Its busiest gym is a Planet Fitness a mere four hundred meters from the centroid of the ZIP, which sees 337,950 visits a year. Only 17.8% of residents say they get no physical activity, better than the statewide rate of 22.9%, and high blood pressure rates are better than average, too: 28.2% compared with 35.3% statewide.
- 141 mapped parks and green spaces, among the highest counts of any winner
- The downtown Planet Fitness draws 337,950 visits a year, about 925 people a day
- The complication: life expectancy is 76.5 years, below the national median, in a ZIP that scores 95 overall
4 measured locations within three kilometers of the ZIP centroid. The busiest sees about 926 people a day.
Maryland
Green means better than the national median across 15,961 ZIP codes. Source: CDC PLACES, 2025 release.
Hampden wins Maryland with scores of 99 for access to gyms and walkability and 98 for access to parks. Only 17.1% of Hampden residents say they get no leisure-time exercise compared with 22.7% statewide, and the percentage who are obese is lower than average, too, at 28.6% compared with a statewide rate of 35.7%. Hampden is lucky to have a Planet Fitness and a Club Pilates within two kilometers.
- Obesity 28.6% here against a Maryland median of 35.7% and a national median of 35.3%
- 140 mapped parks and green spaces within the ZIP
- The defining edge: no factor on this card scores below 92, which only eighteen of the 51 winners manage
2 measured locations within three kilometers of the ZIP centroid. The busiest sees about 410 people a day.
Massachusetts
Green means better than the national median across 15,961 ZIP codes. Source: CDC PLACES, 2025 release.
Boston’s North End earns one of five perfect 100 scores. Obesity is 17.6%, high blood pressure is 15.0%, the percentage of North End residents who get no leisure-time exercise is 11.7%, and the percentage who say they’re in fair or poor health is 7.9%, the second-lowest of the 51 winners. It might help to know that the streets are so skinny you’ll be lucky to find a parking spot.
- Fair or poor health 7.9%, against a national median of 19.7%
- High blood pressure 15.0%, less than half the national median of 35.4%
- The defining edge: perfect 100s for gym access and park access in a ZIP of just 7,126 people
1 measured location within three kilometers of the ZIP centroid. The busiest sees about 141 people a day.
Michigan
Green means better than the national median across 15,961 ZIP codes. Source: CDC PLACES, 2025 release.
Downtown Detroit wins in Michigan, posting a score of 100 for walkability. The area also has a Planet Fitness just nine hundred meters away, which gets 263,394 visits a year. Though health outcomes vary from ZIP to ZIP around the country, rates of obesity (32.6%) and insufficient sleep, 38.1% compared with a national median that’s two percentage points lower, are worse than we’ve seen in other winning ZIPs.
- Walkability scores a perfect 100, one of thirteen winners to manage it
- High blood pressure 30.7% here against a Michigan median of 37.1%
- The exception on this card: 38.1% sleep under seven hours, worse than both the state and the national median
2 measured locations within three kilometers of the ZIP centroid. The busiest sees about 722 people a day.
Minnesota
Green means better than the national median across 15,961 ZIP codes. Source: CDC PLACES, 2025 release.
Downtown Minneapolis wins Minnesota with a score of 99. High blood pressure rates are 19.8%, much lower than the national median (35.4%), with obesity rates at 23.5%, fair or poor self-reported health at 9.3%, and residents who report no leisure-time physical activity at 12.7%.
- Obesity 23.5% here against a Minnesota median of 35.7%, a twelve-point gap
- High blood pressure 19.8%, against a state median of 31.5%
- The defining edge: a perfect 100 for walkability and 99s for both gym access and parks
1 measured location within three kilometers of the ZIP centroid. The busiest sees about 142 people a day.
Mississippi
Compared here against Mississippi’s own median ZIP code rather than the national one. Every figure on this card is still worse than the national median, which is the honest way to read a winner in a state like this one.
Belhaven, a neighborhood of Jackson, wins in Mississippi thanks to a walkable ZIP code: 39202. But like Downtown Detroit, health outcomes include higher-than-other-winning-ZIP rates for high blood pressure (39.0%), obesity (39.4%), and residents who report no leisure-time physical activity at 29.7%, compared with a rate of 36.0% in Mississippi’s median ZIP code.
- High blood pressure 39.0% here against a Mississippi median of 46.6%, the widest gap on this card
- Walkability ranks in the 96th percentile nationally, the reason this ZIP wins at all
- The honest caveat: life expectancy is 75.9 years, below 81% of American ZIP codes, and this is the only winner in the article that trails the national median on all five health measures
Missouri
Green means better than the national median across 15,961 ZIP codes. Source: CDC PLACES, 2025 release.
Kansas City’s downtown loop leads Missouri with scores of 99 for access to gyms and fitness studios, walkability, and access to parks. Adults are less likely to report no leisure-time exercise (17.7%, 30.5% statewide), and ZIP code residents have a lower prevalence of high blood pressure (19.0%, 38.0% statewide) than adults in Missouri’s median ZIP code, a difference of about nineteen points.
- High blood pressure 19.0% here against a Missouri median of 38.0%, a nineteen-point gap
- No leisure-time exercise 17.7% against 30.5% across the state
- The defining edge: three of the four factors score 99, with activity the only column below it at 90
2 measured locations within three kilometers of the ZIP centroid. The busiest sees about 100 people a day.
Montana
Green means better than the national median across 15,961 ZIP codes. Source: CDC PLACES, 2025 release.
Missoula leads Montana. The ZIP code features 142 mapped parks and has a walkability score of 99. Adults are less likely to report no leisure-time exercise (16.8%, 22.5% statewide) than adults in Montana’s median ZIP code, and the percentage of adults reporting short sleep (27.8%) is comparable to the statewide rate. Fitness locations include Orangetheory and Pure Barre. There are no big-box gyms that could be mapped.
- Sleeping under seven hours 27.8%, more than eight points better than the national median
- 142 mapped parks and green spaces, the fourth-highest count of the 51 winners
- The defining edge: walkability 99 out of 100 in one of the least densely populated states in the country
2 measured locations within three kilometers of the ZIP centroid. The busiest sees about 194 people a day.
Nebraska
Green means better than the national median across 15,961 ZIP codes. Source: CDC PLACES, 2025 release.
Omaha’s Countryside area leads Nebraska and has a park access score of 77. There are six fitness locations within three kilometers, including two Genesis Health Clubs and a Crunch that receives 361,972 annual visits. ZIP code residents have an average life expectancy of 81.8, higher than 83% of US ZIP codes. The percentage of adults reporting short sleep (28.9%) is comparable to the statewide rate.
- Life expectancy 81.8 years, higher than 83% of American ZIP codes
- Six measured fitness locations within three kilometers, the densest cluster of any Plains-state winner
- The weak column: park access scores 77, fifth-lowest of the 51 winners
6 measured locations within three kilometers of the ZIP centroid. The busiest sees about 992 people a day.
Nevada
Green means better than the national median across 15,961 ZIP codes. Source: CDC PLACES, 2025 release.
Summerlin leads Nevada and has a walkability score of 71. The area has an indoor fitness culture; it features fitness locations, including a Life Time that receives 757,584 annual visits and a 24 Hour Fitness that receives 453,732 annual visits. ZIP code residents are less likely to be obese (27.6%, 30.7% statewide) than adults in Nevada’s median ZIP code and have an average life expectancy of 81.4.
- The Life Time here draws 757,584 visits a year, roughly 2,075 people a day
- Life expectancy 81.4 years, higher than 79% of American ZIP codes
- The weak column: walkability 71, third-lowest of the 51 winners, in a ZIP that scores 97 for gym access
2 measured locations within three kilometers of the ZIP centroid. The busiest sees about 2,076 people a day.
New Hampshire
Green means better than the national median across 15,961 ZIP codes. Source: CDC PLACES, 2025 release.
Downtown Manchester leads New Hampshire with scores of 99 and 96 for access to parks and access to gyms and fitness studios, but it has an activity score of 55. ZIP code residents fare worse than adults in New Hampshire’s median ZIP code when it comes to leisure-time exercise, obesity, short sleep, and self-described fair or poor health.
- Park access 99 and gym access 96, the two columns carrying this card
- Two Planet Fitness locations within three kilometers, the larger drawing 521,838 visits a year
- The honest caveat: activity scores 55, behind only Mississippi and West Virginia, and life expectancy is 71.4 years, below 98% of American ZIP codes
3 measured locations within three kilometers of the ZIP centroid. The busiest sees about 1,430 people a day.
New Jersey
Green means better than the national median across 15,961 ZIP codes. Source: CDC PLACES, 2025 release.
Princeton leads New Jersey with a walkability score of 100 and a population of 3,325 people. Adults are less likely to report no leisure-time exercise (16.8%, 22.0% statewide) than adults in New Jersey’s median ZIP code, and ZIP code residents have an average life expectancy of 89.1, higher than 99.7% of US ZIP codes.
- Life expectancy 89.1 years, the highest of any winner and above 99.7% of American ZIP codes
- Obesity 22.2% here against a New Jersey median of 28.0% and a national median of 35.3%
- The defining edge: a perfect 100 for walkability in a town of 3,325 people
New Mexico
Green means better than the national median across 15,961 ZIP codes. Source: CDC PLACES, 2025 release.
Santa Fe leads New Mexico with an overall score of 85 and a walkability score of 78. There are no fitness locations we could measure within three kilometers of the ZIP code’s centroid. ZIP code residents are less likely to be obese (23.1%, 36.2% statewide) than adults in New Mexico’s median ZIP code, and fewer report short sleep (27.0%, 34.3% statewide).
- Obesity 23.1% against a New Mexico median of 36.2%, one of the largest state gaps in this article
- Sleeping under seven hours 27.0%, nine points better than the national median
- Read the gym number carefully: the gym-access score of 80 rests on zero mapped fitness venues within three kilometers
New York
Green means better than the national median across 15,961 ZIP codes. Source: CDC PLACES, 2025 release.
Lower Manhattan has an overall score of 100. There are 33 fitness locations within three kilometers of the ZIP code centroid. ZIP code residents have a lower obesity rate (14.6%), lower prevalence of high blood pressure (13.1%), and are less likely to report their overall health as fair or poor (7.3%) than adults in New York’s median ZIP code. Adults are less likely to report no leisure-time exercise (10.8%, 24.2% statewide) than adults in New York’s median ZIP code.
- High blood pressure 13.1% and obesity 14.6%, both the lowest readings of all 51 winners
- 33 mapped fitness venues within three kilometers, the highest count in the country
- The defining edge: 206 mapped parks and green spaces within reach, in the ZIP most people would guess has none
5 measured locations within three kilometers of the ZIP centroid. The busiest sees about 112 people a day.
North Carolina
Green means better than the national median across 15,961 ZIP codes. Source: CDC PLACES, 2025 release.
Charlotte’s Elizabeth neighborhood leads North Carolina with a score of 100 for access to gyms and fitness studios. There are seven fitness locations within three kilometers, none of the top three are big-box gyms, and the nearest is a fitness studio just 100 meters away from the ZIP code centroid. Adults are less likely to report no leisure-time exercise (13.4%, 25.6% statewide) than adults in North Carolina’s median ZIP code, and ZIP code residents have a lower prevalence of high blood pressure (19.8%, 38.8% statewide).
- High blood pressure 19.8% here against a North Carolina median of 38.8%, a nineteen-point gap
- Obesity 25.0% against 36.5% statewide, an eleven-point difference
- The defining edge: 155 mapped parks and green spaces, the third-highest count of the 51 winners
7 measured locations within three kilometers of the ZIP centroid. The busiest sees about 125 people a day.
North Dakota
Green means better than the national median across 15,961 ZIP codes. Source: CDC PLACES, 2025 release.
West Fargo leads North Dakota with an activity score of 94 and has the winning-lowest park access score of 61. The ZIP code’s population is 39,161. There are two fitness locations within three kilometers, which are an F45 and a solidcore, but no big-box gyms we could measure. Adults are less likely to report no leisure-time exercise (16.2%, 24.1% statewide) than adults in North Dakota’s median ZIP code, and ZIP code residents have a lower prevalence of high blood pressure (26.6%, 31.9% statewide).
- High blood pressure 26.6%, nearly nine points better than the national median
- An F45 and a solidcore within three kilometers, both drawing more than 30,000 visits a year
- The weak column: park access 61, the lowest of any winner in this article
2 measured locations within three kilometers of the ZIP centroid. The busiest sees about 171 people a day.
Ohio
Green means better than the national median across 15,961 ZIP codes. Source: CDC PLACES, 2025 release.
Downtown Columbus leads Ohio with a walkability score of 100 and six fitness locations within three kilometers, the top of which receives 355,858 annual visits. Adults are less likely to report no leisure-time exercise (15.6%, 28.3% statewide) than adults in Ohio’s median ZIP code, and ZIP code residents have a lower prevalence of high blood pressure (22.3%, 38.3% statewide). The average life expectancy is 76.0.
- High blood pressure 22.3% here against an Ohio median of 38.3%, a sixteen-point gap
- Obesity 28.2% against 38.2% statewide
- The complication: life expectancy 76.0 years, below 80% of American ZIP codes, in a ZIP scoring 97 overall
6 measured locations within three kilometers of the ZIP centroid. The busiest sees about 975 people a day.
Oklahoma
Green means better than the national median across 15,961 ZIP codes. Source: CDC PLACES, 2025 release.
Midtown Oklahoma City leads Oklahoma with a park access score of 100. The area has a population of 5,046 people. There are fitness locations nearby; the nearest is a Vasa Fitness 2.5 kilometers away that receives 501,258 annual visits. Adults are less likely to report no leisure-time exercise (19.8%, 33.5% statewide) than adults in Oklahoma’s median ZIP code, and ZIP code residents have a lower prevalence of high blood pressure (27.5%, 40.6% statewide).
- High blood pressure 27.5% here against an Oklahoma median of 40.6%, a thirteen-point gap
- The Vasa Fitness nearby draws 501,258 visits a year, about 1,375 people a day
- The defining edge: a perfect 100 for park access, one of only seven winners to score it
2 measured locations within three kilometers of the ZIP centroid. The busiest sees about 1,373 people a day.
Oregon
Green means better than the national median across 15,961 ZIP codes. Source: CDC PLACES, 2025 release.
Portland’s Eliot and Boise neighborhoods lead Oregon with a perfect score of 100 in gym access and walkability. There are 10 gyms within three kilometers, six of which are chains for which we know the number of annual visits, including an LA Fitness (303,008 annual visits) and a CorePower Yoga. On the other hand, only 15.0% of residents don’t get any leisure-time physical activity compared to 21.2% in Oregon, and just 23.1% of them have high blood pressure, compared with 33.9% in Oregon.
- High blood pressure 23.1% here against an Oregon median of 33.9%
- Ten mapped fitness venues within three kilometers, six of them measured chain locations
- The defining edge: perfect 100s for gym access and walkability, matched by only a handful of ZIP codes nationally
6 measured locations within three kilometers of the ZIP centroid. The busiest sees about 830 people a day.
Pennsylvania
The 2025 CDC release publishes no ZIP-level chronic-disease data for Pennsylvania. The sleep figure is for ZIP 15222 against the national ZIP median; the remaining rows are Allegheny County figures from County Health Rankings 2024, compared against the national county median.
In Pennsylvania, the Strip District in Pittsburgh wins out over neighborhoods in Philadelphia and the suburbs. It has a perfect score of 100 in walkability, and is in the 99th percentile nationwide in gym and park access. There are just two fitness studios within the ZIP code, neither of them your typical weight-lifting gym, and the busiest isn’t even a chain, for which we know annual visits, but a Pilates studio. The Strip District used to be known as Pittsburgh’s warehouse district for fresh produce, but has been increasingly used as a place to live.
- Walkability is a perfect 100, one of thirteen winners to hit it
- 209 mapped parks and green spaces within reach, despite a resident population under 6,000
- The defining edge: solidcore on Smallman Street draws 50,492 visits a year, roughly 138 people a day into a single studio
2 measured locations within three kilometers of the ZIP centroid. The busiest sees about 138 people a day.
Rhode Island
Green means better than the national median across 15,961 ZIP codes. Source: CDC PLACES, 2025 release.
In Rhode Island, the winner is Providence’s East Side, which has a score of 99 in walkability, but has its lowest score (87) in gym access. There are just three gyms within three kilometers that we can measure, with two in Pawtucket. The good news? Its life expectancy is 82.2 years, better than 86% of ZIP codes nationwide. There are 25,559 residents in this ZIP code; 19.4% say they don’t get any leisure-time physical activity, vs. 22.4% in Rhode Island.
- Life expectancy 82.2 years, higher than 86% of American ZIP codes
- High blood pressure 26.4% here against a Rhode Island median of 34.0%
- The weak column: gym access 87, the lowest of any winner in the Northeast
3 measured locations within three kilometers of the ZIP centroid. The busiest sees about 700 people a day.
South Carolina
Green means better than the national median across 15,961 ZIP codes. Source: CDC PLACES, 2025 release.
Downtown Charleston wins out in South Carolina. It has a perfect score of 100 in walkability, and just 27.0% of its residents get less than seven hours of sleep, vs. 37.3% in South Carolina. There are three gyms within three kilometers that we can measure. Unfortunately, none of them are big-box gyms for which we know annual visits, but three boutique gyms, including a Barry’s Bootcamp, BODYROK and Pure Barre.
- Sleeping under seven hours 27.0% here against a South Carolina median of 37.3%
- Obesity 26.1% against 37.3% statewide, an eleven-point gap
- The defining edge: three measured boutique studios within three kilometers and no big-box gym among them
3 measured locations within three kilometers of the ZIP centroid. The busiest sees about 146 people a day.
South Dakota
Green means better than the national median across 15,961 ZIP codes. Source: CDC PLACES, 2025 release.
In South Dakota, Sioux Falls wins with scores of 85 in gym access, 70 in activity, 88 in walkability and 76 in park access. 27.5% of residents get less than seven hours of sleep, better than the national median of 36.1%. But its obesity rate of 35.7% is the fourth of four winning ZIP codes above the national median.
- Sleeping under seven hours 27.5%, nearly nine points better than the national median
- A Planet Fitness one kilometer from the centroid drawing 215,100 visits a year
- The exception on this card: obesity 35.7%, fractionally above the national median of 35.3%
2 measured locations within three kilometers of the ZIP centroid. The busiest sees about 589 people a day.
Tennessee
Green means better than the national median across 15,961 ZIP codes. Source: CDC PLACES, 2025 release.
Belmont and Hillsboro, an upscale, leafy area in Nashville, leads the way in Tennessee. Its high blood pressure rate of 18.4% is much lower than the rate of 41.7% in Tennessee. Its obesity rate (22.9%) is lower than the rate in Tennessee (39.1%). There are nine gyms within three kilometers that we can measure. Unfortunately, the top three are boutique studios.
- High blood pressure 18.4% against a Tennessee median of 41.7%, a twenty-three point gap and the largest in this article
- Obesity 22.9% here against 39.1% statewide
- The defining edge: nine measured fitness locations within three kilometers, led by a BODYROK at 65,376 visits a year
9 measured locations within three kilometers of the ZIP centroid. The busiest sees about 179 people a day.
Texas
Green means better than the national median across 15,961 ZIP codes. Source: CDC PLACES, 2025 release.
Houston’s Upper Kirby wins Texas, with 18 gyms that are chains for which we know the number of annual visits within three kilometers, including an EoS Fitness (904,882 annual visits) and a Life Time (645,104 annual visits). And only 13.0% of residents don’t get any leisure-time physical activity, compared to 28.9% in Texas. Only 9.7% rate their own health as fair or poor, compared to 23.0% in Texas.
- Eighteen measured fitness locations within three kilometers, the densest cluster of all 51 winners
- Fair or poor health 9.7% here against a Texas median of 23.0%
- The defining edge: the nearby EoS Fitness draws 904,882 visits a year, about 2,480 people a day
18 measured locations within three kilometers of the ZIP centroid. The busiest sees about 2,479 people a day.
Utah
Green means better than the national median across 15,961 ZIP codes. Source: CDC PLACES, 2025 release.
Downtown Salt Lake City comes out on top in Utah with an overall score of 98 and a perfect score of 100 in gym access and walkability. There are six gyms within three kilometers, all of which are mapped venues. But only 17.0% of residents don’t get any leisure-time physical activity, not much different from the rate of 17.1% in Utah, while its life expectancy of 70.1 years is worse than 99% of ZIP codes nationwide.
- Perfect 100s for both gym access and walkability
- High blood pressure 24.2%, eleven points better than the national median
- The contradiction: life expectancy 70.1 years, below 99% of American ZIP codes, in the ZIP that scores 98 for fitness
4 measured locations within three kilometers of the ZIP centroid. The busiest sees about 237 people a day.
Vermont
Green means better than the national median across 15,961 ZIP codes. Source: CDC PLACES, 2025 release.
Burlington wins out in Vermont. There are 32,059 residents in this ZIP code; its score in park access is 75, its obesity rate is 23.4% compared to 29.1% in Vermont, its high blood pressure rate is 19.6%, better than 32.1% in Vermont, and 26.9% sleep under seven hours. The closest chain gym within three kilometers for which we know annual visits is a Pure Barre in South Burlington.
- High blood pressure 19.6% here against a Vermont median of 32.1%
- Sleeping under seven hours 26.9%, more than nine points better than the national median
- The weak column: park access 75, tied with Arkansas for second-lowest of the 51 winners, in the state most people associate with green space
1 measured location within three kilometers of the ZIP centroid. The busiest sees about 37 people a day.
Virginia
Green means better than the national median across 15,961 ZIP codes. Source: CDC PLACES, 2025 release.
In Virginia, Alexandria’s Del Ray neighborhood has a score of 98 or higher in all factors. Only 14.1% of residents don’t get any leisure-time physical activity compared to 25.1% in Virginia, and 25.3% of them have high blood pressure compared to 37.5% in Virginia. The closest chain gym within three kilometers for which we know annual visits is an Onelife Fitness (419,464 annual visits).
- High blood pressure 25.3% here against a Virginia median of 37.5%
- No factor on this card scores below 98, matching California and Washington for the steadiest card outside the perfect ZIPs
- The defining edge: the Onelife Fitness nearby draws 419,464 visits a year, about 1,150 people a day
3 measured locations within three kilometers of the ZIP centroid. The busiest sees about 1,149 people a day.
Washington
Green means better than the national median across 15,961 ZIP codes. Source: CDC PLACES, 2025 release.
Downtown Seattle takes the win in Washington with an overall score of 99 and a perfect score of 100 in gym access, activity and walkability, as well as an obesity rate of 20.9% against 33.4% statewide and only 11.7% not getting any leisure-time physical activity. We can’t show you how busy Seattle’s gyms are, though, because not enough gyms within three kilometers, of which there are 15, are part of the gym chain panel.
- Obesity 20.9% here against a Washington median of 33.4%, a twelve-point gap
- Perfect 100s for gym access, activity and walkability, the only winner outside the five 100-point ZIPs with three perfect columns
- The data note: Washington is missing from our measured chain panel, so no visit figures appear on this card
Washington D.C.
Green means better than the national median across 15,961 ZIP codes. Source: CDC PLACES, 2025 release.
Logan Circle scores a perfect 100. There are 25 gyms within three kilometers. Obesity affects 20.4% of residents and 20.4% have high blood pressure, rates that aren’t that different than medians in the District.
- Twenty-five mapped fitness venues within three kilometers, tied with the Chicago Loop and behind only Lower Manhattan
- Fair or poor health 9.6%, ten points better than the national median
- Read the state comparison carefully: the District is a single city, so its own median ZIP is already urban and the gaps here look smaller than they do elsewhere
2 measured locations within three kilometers of the ZIP centroid. The busiest sees about 182 people a day.
West Virginia
Compared here against West Virginia’s own median ZIP code rather than the national one. Every figure on this card is still worse than the national median, which is the honest way to read a winner in a state like this one.
Kanawha City takes the number one spot in West Virginia with a score of 73. Like the top-performer in Mississippi, Kanawha City falls short of the nation’s health outcomes. High blood pressure is 42.3%, which is seven percentage points higher than the national median, making it the highest of the group. Only 26.7% of Kanawha City residents have no leisure-time exercise, which is still better than the West Virginia median of 33.5%. Kanawha City has a walkability score of 70, making it the lowest of the group except for those in Wyoming.
- No leisure-time exercise 26.7% here against a West Virginia median of 33.5%
- Fair or poor health 19.3% against 26.2% statewide, the widest gap on this card
- The honest caveat: high blood pressure 42.3%, the worst reading of any winner, and one of only two cards here that trails the national median on most of the five
1 measured location within three kilometers of the ZIP centroid. The busiest sees about 276 people a day.
Wisconsin
Green means better than the national median across 15,961 ZIP codes. Source: CDC PLACES, 2025 release.
Madison’s near-west side has perfect gym access with three gyms within three kilometers. Madison’s near-west side has an average life expectancy of 85.9 years, better than 98% of ZIP codes in America, making it the second-highest of the group. High blood pressure is 18.7% here, much lower than the 33.9% rate throughout Wisconsin. solidcore leads the pack with 97,290 yearly visits.
- Life expectancy 85.9 years, higher than 98% of American ZIP codes
- High blood pressure 18.7% here against a Wisconsin median of 33.9%, a fifteen-point gap
- The defining edge: the solidcore here draws 97,290 visits a year, more than double the national median for its chain
3 measured locations within three kilometers of the ZIP centroid. The busiest sees about 267 people a day.
Wyoming
Green means better than the national median across 15,961 ZIP codes. Source: CDC PLACES, 2025 release.
Laramie is Wyoming’s top-performer with a score of 79. It also has the lowest walkability score in the group (60). Obesity is 27.7% in Laramie, lower than the 35.0% rate in Wyoming. High blood pressure is also lower than the rest of the state: 24.8% in Laramie and 32.0% in Wyoming. The percentage of Laramie residents reporting their health as fair/poor is 16.1%. Laramie has no measured gyms within three kilometers. Wyoming has the fewest gyms measured, a total of nine locations in the state, belonging to the major fitness chains.
- Obesity 27.7% here against a Wyoming median of 35.0%
- High blood pressure 24.8%, nearly eleven points better than the national median
- Read the gym number carefully: the gym-access score of 80 rests on zero mapped fitness venues within three kilometers, and Wyoming has just nine measured chain gyms statewide
All 51 Winners on One Map
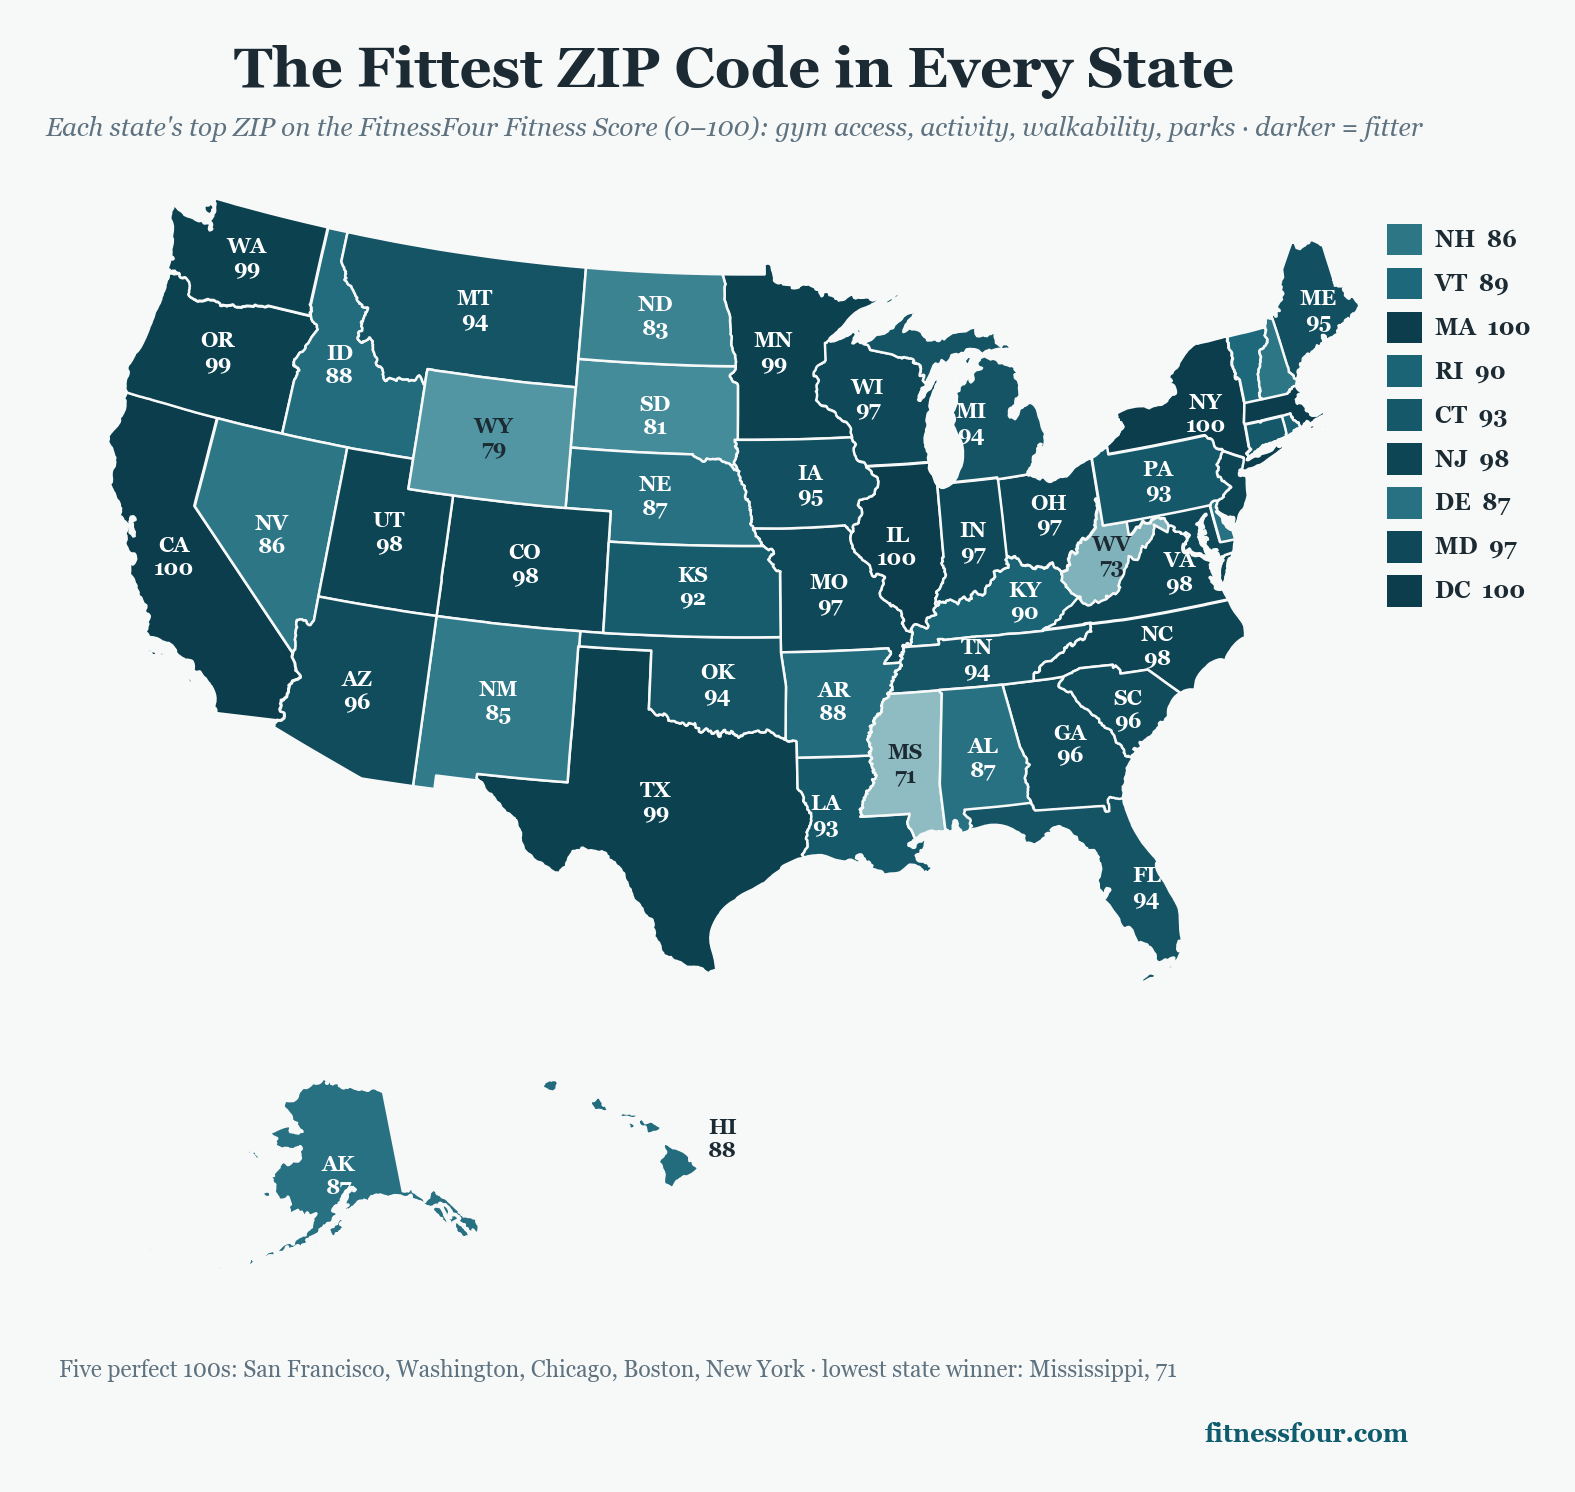
The pattern the map makes is not subtle. The highest scores cluster in dense, walkable cores, and the lowest state winners sit in places where the nearest gym is a drive and the sidewalks give out. Mississippi’s winner scores 71 and West Virginia’s 73, while five ZIP codes score a perfect 100. The gap between the best neighborhood in one state and the best in another is often wider than the gap between neighborhoods inside a single city.
How We Built the Fitness Score
Gym and studio density comes from our proprietary location dataset covering more than 700 national chains plus mapped independent fitness venues, measured within three kilometers of each ZIP code and adjusted for population. Visit counts on the cards are annualized from a November 1, 2025 to April 30, 2026 measurement window and count visits rather than unique members. Physical activity rates come from the CDC PLACES project, 2025 release, with County Health Rankings 2024 county data filling states where CDC coverage is incomplete. Walkability comes from the EPA Smart Location Database. Park access combines federally mapped protected areas with our own green-space mapping. Scores are national percentiles weighted 35/25/25/15 across the four factors, computed for the 17,747 residential ZIP codes with complete data.
The five health measures on each card are crude prevalence estimates from CDC PLACES, 2025 release, for adults 18 and over. National medians are calculated across the 15,961 ZIP codes that carry all five measures and have a population above 2,500: no leisure-time physical activity 25.5%, obesity 35.3%, sleeping under seven hours 36.1%, high blood pressure 35.4%, and fair or poor self-rated health 19.7%. State medians use the same population floor. Life expectancy comes from the CDC and National Center for Health Statistics small-area estimates and is not published for every ZIP code.
Two limits are worth stating plainly. The CDC’s 2025 ZIP-level release contains no chronic-disease values for Pennsylvania or Kentucky, so both of those cards use county figures where noted. And our mapped venue layer is thinner in some places than others, so a handful of cards carry a gym-access score without a single measured venue nearby; where that happens, the card says so rather than leaving you to assume the neighborhood has no gyms.